#OSMC 2018 – Day 0: Prometheus Training

To most people, monitoring is not exciting, but it seems lately that the most exciting thing in monitoring is the Prometheus project. As a project endorsed by the Cloud Native Computing Foundation, Prometheus is getting a lot of attention, especially in the realm of cloud applications and things like monitoring Kubernetes.

At this year’s Open Source Monitoring Conference they offered a one day training course, so I decided to take it to see what all the fuss was about. I apologize in advance that a lot of this post will be comparing Prometheus to OpenNMS, but in case you haven’t guessed I’m biased (and a bit jealous of all the attention Prometheus is getting).

The class was taught by Julien Pivotto who is both a Prometheus user and a decent instructor. The environment consisted of 15 students with laptops set up on a private network to give us something to monitor.

Prometheus is written in Go (I’m never sure if I should call it “Go” or if I need to say “Golang”) which makes it compact and fast. We installed it on our systems by downloading a tarball and simply executing the application.

Like most applications written in the last decade, the user interface is accessed via a browser. The first thing you notice is that the UI is incredibly minimal. At OpenNMS we get a lot of criticism of our UI, but the Prometheus interface is one step above the Google home page. The main use of the web page is for querying collected metrics, and a lot of the configuration is done by editing YAML files from the command line.

Once Prometheus was installed and running, the first thing we looked at was monitoring Prometheus itself. There is no real magic here. Metrics are exposed via a web page that simply lists the variables available and their values. The application will collect all of the values it finds and store them in a time series database called simply the TSDB.

The idea of exposing metrics on a web page is not new. Over a decade ago we at OpenNMS were approached by a company that wanted us to help them create an SNMP agent for their application. We asked them why they needed SNMP and found they just wanted to expose various metrics about their app to monitor its performance. Since it ran on Linux system with an embedded web server, we suggested that they just write the values to a file, put that in the webroot, and we would use the HTTP Collector to retrieve and store them.

The main difference between that method and Prometheus is that the latter expects the data to be presented in a particular format, whereas the OpenNMS method was more free-form. Prometheus will also collect all values presented without extra configuration, whereas you’ll need to define the values of interest within OpenNMS.

In Prometheus there is no real auto-discovery of devices. You edit a file in which you create a “job”, in our case the job was called “Prometheus”, and then you add “targets” based on IP address and port. As we learned in the class, for each different source of metrics there is usually a custom port. Prometheus stats are on port 9100, node data is exposed on 9090 via the node_exporter, etc. When there is an issue, this can be reflected in the status of the job. For example, if we added all 15 Prometheus instances to the job “Prometheus” and one of them went down, then the job itself would show as degraded.

After we got Prometheus running, we installed Grafana to make it easier to display the metrics that Prometheus was capturing. This is a common practice these days and a good move since more and more people are becoming familiar it. OpenNMS was the first third-party datasource created for Grafana, and the Helm application brings bidirectional functionality for managing OpenNMS alarms and displaying collected data.

After that we explored various “components” for Prometheus. While a number of applications are exposing their data in a format that Prometheus can consume, there are also other components that can be installed, such as the node_exporter which displays server-related metrics and to provide data that isn’t otherwise natively available.

The rest of the class was spent extending the application and playing with various use cases. You can “alertmanager” to trigger various actions based on the status of metrics within the system.

One thing I wish we could have covered was the “push” aspect of Prometheus. Modern monitoring is moving from a “pull” model (i.e. SNMP) to a “push” model where applications simply stream data into the monitoring system. OpenNMS supports this type of monitoring through the telemetryd feature, and it would be interesting to see if we could become a sink for the Prometheus push format.

Overall I enjoyed the class but I fail to see what all the fuss is about. It’s nice that developers are exposing their data via specially formatted web pages, but OpenNMS has had the ability to collect data from web pages for over a decade, and I’m eager to see if I can get the XML/JSON collector to work with the native format of Prometheus. Please don’t hate on me if you really like Prometheus – it is 100% open source and if it works for you then great – but for something to manage your entire network (including physical servers and especially networking equipment like routers and switches) you will probably need to use something else.

[Note: Julien reached out to me and asked that I mention the SNMP_Exporter which is how Prometheus gathers data from devices like routers and switches. It works well for them and they are actively using it.]
Choose the Right Thermometer

Okay, so I have a love/hate relationship with Centurylink. Centurylink provides a DSL circuit to my house. I love the fact that I have something resembling broadband with 10Mbps down and about 1Mbps up. Now that doesn’t even qualify as broadband according to the FCC, but it beats the heck out of the alternatives (and I am jealous of my friends with cable who have 100Mbps down or even 300Mbps).

The hate part comes from reliability, which lately has been crap. This post is actually focused on OpenNMS so I won’t go into all of my issues, but I’ve been struggling with long outages in my service.

The latest issue is a new one: packet loss. Usually the circuit is either up or completely down, but for the last three days I’ve been having issues with a large percentage of dropped packets. Of course I monitor my home network from the office OpenNMS instance, and this will usually manifest itself with multiple nodeLostService events around HTTP since I have a personal web server that I monitor.

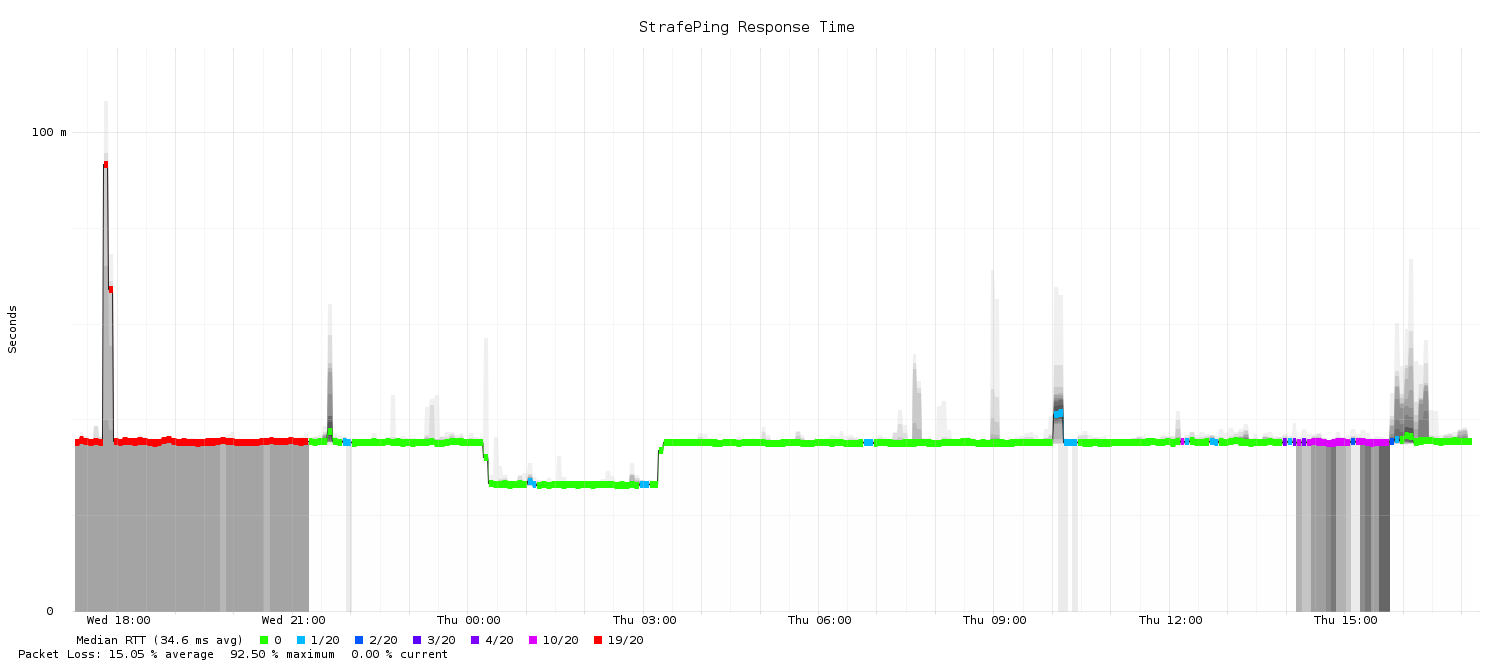
The default ICMP monitor does not measure packet loss. As long as at least one ping reply makes it, ICMP is considered up, so the node itself remains up. OpenNMS does have a monitor for packet loss called Strafeping. It sends out 20 pings in a short amount of time and then measures how long they take to come back. So I added it to the node for my home and I saw something unusual: a consistent 19 out of 20 lost packets.

Strafeping Graph

Power cycling the DSL modem seems to correct the problem, and the command line ping was reporting no lost packets, so why was I seeing such packet loss from the monitor? Was Strafeping broken?

While it is always a possibility, I didn’t think that Strafeping was broken, but I did check a number of graphs for other circuits and they looked fine. Thus it had to be something else.

This brings up a touchy subject for me: false positives. Is OpenNMS reporting false problems?

It reminds me of an event happened when I was studying physics back in the late 1980s. I was working with some newly discovered ceramic material that exhibited superconductivity at relatively high temperatures (around 92K). That temperature can be reached using liquid nitrogen, which was relatively easy to source compared to cooler liquids like liquid helium.

I needed to measure the temperature of the ceramic, but mercury (used in most common thermometers) is a solid at those temperatures, so I went to my advisor for suggestions. His first question to me was “What does a thermometer measure?”

I thought it was a trick question, so I answered “temperature” (“thermo” meaning temperature and meter meaning “to measure”). He replied, “Okay, smart guy, the temperature of what?”

That was harder to answer exactly, so I said vague things like the ambient environment, whatever it was next to, etc. He interrupted me and said “No, a thermometer measures one thing: the temperature of the thermometer”.

This was an important lesson, even though it seems obvious. In the case of the ceramic it meant a lot of extra steps to make sure the thermometer we were using (which was based on changes in resistance) was as close to the temperature of the material as possible.

What does that have to do with OpenNMS? Well, OpenNMS is like that thermometer. It is up to us to make sure that the way we decide to use it for monitoring is as close to our criteria as possible. A “false positive” usually indicates a problem with the method versus the tool – OpenNMS is behaving exactly as it should but we need to match it better to what we expect.

In my case I found out the router I use was limited by default to responding 1 ping per second (to avoid DDoS attacks I assume), so last night when I upped that to allow 20 pings per second Strafeping started to work as expected (as you can see in the graph above).

This allowed me to detect when my DSL circuit packet loss started again today. A little after 14:00 the system detected high packet loss. When this happened before, power cycling the modem seemed to fix it, so I headed home to do just that.

While I was on the way, around 15:30, the packet loss seemed to improve, but as you can see from the graph the ping times were all over the place (the line is green but there is a lot of extra “smoke” around it indicating a variance in the response times). I proactively power cycled the modem and things settled down. The Centurylink agent agreed to send me a new modem.

The point of this post is to stress that you need to understand how your monitoring tools actually work and you can often correct issues that make a monitor unusable and turn it into to something useful. Choose the right thermometer.

Agent Provocateur

I’ve been involved with the monitoring of computer networks for a long time, two decades actually, and I’m seeing an alarming trend. Every new monitoring application seems to be insisting on software agents. Basically, in order to get any value out of the application, you have to go out and install additional software on each server in your network.

Now there was a time when this was necessary. BMC Software made a lot of money with its PATROL series of agents, yet people hated them then as much as they hate agents now. Why? Well, first there was the cost, both in terms of licensing and in continuing to maintain them (upgrades, etc.). Next there was the fact that you had to add software to already overloaded systems. I can remember the first time the company I worked for back then deployed a PATROL agent on an Oracle database. When it was started up it took the database down as it slammed the system with requests. Which leads me to the final point, outside of security issues that arise with an increase in the number of applications running on a system, the moment the system experiences a problem the blame will fall on the agent.

Despite that, agents still seem to proliferate. In part I think it is political. Downloading and installing agents looks like useful work. “Hey, I’m busy monitoring the network with these here agents”. Also in part, it is laziness. I have never met a programmer who liked working on someone else’s code, so why not come up with a proprietary protocol and write agents to implement it?

But what bothers me the most is that it is so unnecessary. The information you need for monitoring, with the possible exception of Windows, is already there. Modern operating systems (again, with the exception of Windows) ship with an SNMP agent, usually based on Net-SNMP. This is a secure, powerful extensible agent that has been tried and tested for many years, and it is maintained directly on server itself. You can use SNMPv3 for secure communications, and the “extend” and “pass” directives to make it easy to customize.

Heck, even Windows ships with an extensible SNMP agent, and you can also access data via WMI and PowerShell.

But what about applications? Don’t you need an agent for that?

Not really. Modern applications tend to have an API, usually based on ReST, that can be queried by a management station for important information. Java applications support JMX, databases support ODBC, and when all that fails you can usually use good ol’ HTTP to query the application directly. And the best part is that the application itself can be written to guard against a monitoring query causing undue load on the system.

At OpenNMS we work with a lot of large customers, and they are loathe to install new software on all of their servers. Plus, many of our customers have devices that can’t support additional agents, such as routers and switches, and IoT devices such as thermostats and door locks. This is the main reason why the OpenNMS monitoring platform is, by design, agentless.

A critic might point out that OpenNMS does have an agent in the remote poller, as well as in the upcoming Minion feature set. True, but those act as “user agents”, giving OpenNMS a view into networks as if it was a user of those networks. The software is not installed on every server but instead it just needs the same access as a user would have. So, it can be installed on an existing system or on a small system purchased for that purpose, at a minimum just one for each network to be monitored.

While some new IT fields may require agents, most successful solutions try to avoid them. Even in newer fields such as IT automation, the best solutions are agentless. They are not necessary, and I strongly suggest that anyone who is asked to install an agent for monitoring question that requirement.

Announcing the OpenVND Project

OpenNMS has many uses, from insuring that customers of a billion dollar pizza business get their food on time to maintaining the machines that guard nuclear fuel, but we all know what we really need.

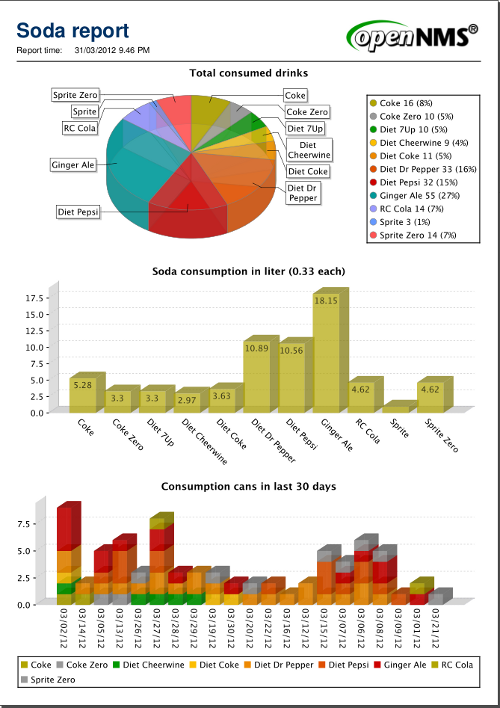
A way to manage our soda machines.

Nothing says “ugly” like a bunch of geeks, and nothing is uglier than when those same geeks are deprived of caffeine.

Thus today, the OpenNMS Project is happy to announce the Open VeNDing Project (OpenVND), leveraging the power of OpenNMS to address this need for the greater good.

Visit www.openvnd.org today for the full details.

Does Monitoring Really Suck?

I’ve been seeing the phrase “monitoring sucks” lately. Recently, Kris Buytaert organized a “monitoring sucks” hackathon after FOSDEM, and in a similar vein Cliff Moon, the CTO of Boundary (a monitoring service provider), also posted a “Why monitoring sucks – for now” article.

Working with OpenNMS as I have for the last decade, I really can’t share the sentiment that things suck. Having spent the decade before that as a consultant working with products like HP’s OpenView, Micromuse NetCool, Concord Network Health and BMC’s PATROL, we set out with OpenNMS to build the best tool for consultants like me – something that combines the functions of all of these products under one umbrella, with the ability to quickly and easily expand that functionality as needed. That’s why you’ll hear me refer to OpenNMS as a network management application platform instead of just an application.

OpenNMS has been addressing a lot of the concerns raised in Mr. Moon’s article for years now. Unlike point products that focus on data collection or service monitoring or trending, OpenNMS does all of them in one package. It also includes functions, such as inventory, that aren’t usually addressed in a monitoring solution. With easy, API-level integration with trouble ticketing systems (Request Tracker, OTRS, Jira, etc.) and configuration tools like RANCID, OpenNMS can be easily expanded as a given network environment grows.

We realized a long time ago that traditional alerting mechanisms were broken, so in addition to such staples as “high” and “low” thresholding, we added “relative” and “absolute” options as well to better detect anomalies. The built in alarms subsystem allows for complex automations to be created, and the event translator does a great job of enriching basic events with information such as customer impact. Finally, with 1.10 we’ve resurrected and improved the OpenNMS integration with Drools, where extremely complex analysis can be built into the system to streamline alerting. This is a key feature that led Juniper to license OpenNMS as part of their JunOS Space management product.

But I have to ask myself, if OpenNMS is so cool at solving management problems, why do people still think things suck? I can think of two reasons, although I’m sure that there are many more.

The first is that OpenNMS is written in Java, and a lot of those in the “devops” world either have no Java experience or they are prejudiced against it. The second is that OpenNMS is a seriously complex platform, and unlike some of the point products mentioned it really does take an investment of time to get the most out of it.

I can’t do much about the former issue, and history seems to have demonstrated that if people are prejudiced enough against a better solution they will eventually get left behind. I’m not saying that Java is great or even that Java is better than other options, but in many cases OpenNMS is better than the options and if Java is what’s keeping you away from it, then that’s a shame.

But the second issue I can address, and we hope to do so this year in a number of ways. The best way to help people climb the learning curve with OpenNMS is in education, and we even delayed the release of OpenNMS 1.10 in order to get the documentation to a much higher level than it has been in the past. Also this year we are having a couple of users conferences focusing on addressing real world and real time solutions, as well as increasing the number of our training courses. Finally, I hope to put together some videos to jumpstart those interested in coming up to speed with the platform.

So if you think monitoring sucks, please check out OpenNMS. Perhaps we can change your mind.

A Little Microsoft and VMWare Rant

I’m out at a customer site this week, and while the customer is awesome, a couple of things have made me very frustrated.

The first concerns Windows Management Instrumentation (WMI). OpenNMS now supports native WMI (thanks mainly to Matt Raykowski) and this is the first time I got to play with it. Works like a charm and how you would expect with OpenNMS – simply. I edited wmi-config.xml, put in a valid username and password, edited capsd-configuration.xml to discover WMI, and turned it on in collectd-configuration.xml. Restart, and now I’m collecting a ton of WMI stats out of the box.

So far, so good.

One of their concerns is monitoring Exchange 2007. So I think, great, I’ll just configure some WMI classes and objects dealing with Exchange, make some graphs, and we’re done.

Not so fast.

First, there doesn’t seem to be a good place to get a list of all the available WMI classes easily. I did find some rather thick Technet docs, but for the most part it is a lot of digging. It would be nice if there was a MIB-like document that described them.

Second, it turns out that Exchange 2007 doesn’t support WMI. You have to use Powershell “cmdlets” and script it from there.

What?

Okay, so Microsoft decides that SNMP isn’t good enough to use for exchanging data between a manager and an agent, so they invent their own management protocol called WMI, and a few years later decide it isn’t worth supporting.

(sigh)

My second source of frustration deals with VMWare. The client currently uses ESX, so I’m like – hey, just go in, enable the Net-SNMP agent, enable the “dlmod” for the ESX MIB and we’re set.

That is all well and good, but they are migrating everything to ESXi which, wait for it, doesn’t support SNMP. Well, at least GETs.

From the VMWare documentation (PDF), you first get:

… hardware monitoring through SNMP continues to be supported by ESXi, and any third-party management application that supports SNMP can be used to monitor it. For example, Dell OpenManage IT Assistant (version 8.1 or later) has ESXi MIBs pre-compiled and integrated, allowing basic inventory of the server and making it possible to monitor hardware alerts such as a failed power supply. SNMP also lets you monitor aspects of the state of the VMkernel, such as resource usage, as well as the state of virtual machines.

Okay, good, but the next paragraph reads

ESXi ships with an SNMP management agent different from the one that runs in the service console of ESX 3. Currently, the ESXi SNMP agent supports only SNMP traps, not gets.

Again, what?

I mean, okay, traps are great, but how am I supposed to monitor “resource usage” if I can’t do a GET?

In both cases there does exist a non-standard, proprietary API that can be used to mine this data, and if the demand is high enough we’ll definitely put it into OpenNMS. Thank goodness the architecture is abstracted so that it is easy to add such plugins without having to re-write everything.

But, c’mon people, we have standards for a reason. Can’t we all just get along?

OpenNMS in the Cloud

One of the things I hate is the buzzword du jour, be it virtualization, “devops” or “the cloud“. It’s not that there isn’t some nugget of truth in all of the press surrounding such things, but one of the reasons I got into open source in the first place was its focus on results and not fluff.

With a commercial software product it is very difficult to determine if it is the right solution to a particular problem without buying it. With open source software, there is no licensing cost and thus it is possible to easily try it out before making a commitment to use it. Thus the focus is on usefulness and not a flyer saying “we’re the best”.

This isn’t to say that the open source world is completely free of fluff and posturing. With the prevalence of venture-backed open core companies, their ultimate goal is not the proliferation of robust open source code but to be purchased for a large multiplier. The best way for them to create perceived value is to latch on to the latest buzzword, as if to say “hey – you need a piece of this – better hurry up and buy us,” and it is a strategy that has worked well in a number of cases. I just don’t like calling it open source.

So I have been pretty quiet on the use of OpenNMS in “the cloud”. This isn’t to say that we don’t manage cloud resources, but the management challenges of cloud-based services aren’t much different than “normal” ones. The power and flexibility of OpenNMS make it as useful in the cloud as elsewhere.

In fact, one of the major players in cloud computing, Rackspace, uses OpenNMS to manage its Cloud Files system.

We are happy to announce that we are working with another major company BT (British Telecom Group) in developing a trusted cloud management platform called the Cloud Service Broker. In the words of John Gillam, Programme Director, BT Global Services:

The Cloud Service Broker TM Forum Catalyst provides an excellent opportunity to address the barriers to cloud adoption for enterprise customers. Whilst enterprises wish to lever value from the cloud, they are apprehensive over losing control, citing areas of concern such as IT Governance, application performance, runaway costs, inadequate security and technology lock-in. The CSB addresses this by matching cloud services to each enterprise’s needs, enforcing the right policies, and then showing how this can be backed up by an ongoing service level agreement. We believe developments of this nature will be of primary importance in future cloud services.

We will be presenting our work at the TMForum’s Management World conference in Nice, France, this May. In addition to BT’s offering, we will be demonstrating integration with products from Comptel, Square Hoop and Infonova in order to deliver a complete cloud services platform.

Interop 2009

In my commercial software days I used to go to the Interop show in Las Vegas, back when it was held at the main convention center. It was a huge show and pretty much the premiere event for networking gear. I think the last time I went was 2000.

I had the opportunity to return this year. The show has changed, it is now in the Mandalay Bay Convention Center and it is smaller than I remember. The NOC staff, however, is still pretty much the same.

As you can imagine, running a NOC at a show like this is no minor undertaking, but believe it or not the entire NOC is staffed by volunteers. Getting through an ordeal like an Interop show seems to bring people together, as many volunteers have been coming for years (I met one guy who had been coming here since 1996). The only downside was that this Interop marked the first since the passing of Jim “Haggis” Brown, a longtime NOC member. They had a place set out for him, along with a bottle of scotch.

Speaking of bringing people together, this trip has been pretty serendipitous. For example, my plane from RDU to DFW had mechanical problems, so they routed me through Miami. As I was leaving the Admirals Club to walk to my gate, I ended up sharing an elevator with Chris McGugan. Chris is something of a superstar in networking circles. He was at Cisco for many years (based out of North Carolina), and now he is working at Avaya out in California. We used to share a townhouse about 20 years ago, and it had been about that long since I’d seen him. The odds of us running into each other the way we did were pretty long.

Even stranger, Chris used to work in the NOC at Interop, and he knew many of the people I had come to meet.

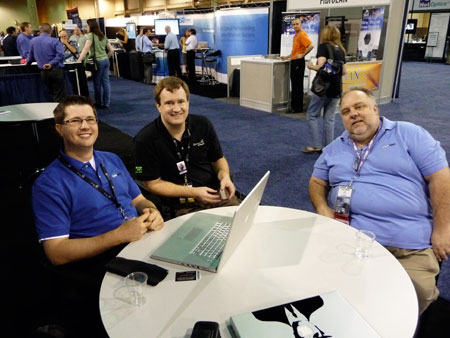
Another example of serendipity: on our first day at the show, Jeff and I were at a table utilizing some wireless bandwidth when John Willis walked by. He didn’t know we were going to be there, so it was nice to see he had decided to wear his OpenNMS shirt anyway.


Jeff Gehlbach, High Mobley and John Willis

Things have changed a bit in Las Vegas since I was last here. There is no smoking near food (which pretty much leaves the casinos) and coins no longer work in the slot machines. Payouts are given on little slips of paper, and the machines will only accept bills or those little slips. I really miss the sound of the coins clanking around, and it makes the casinos seem quieter.

According to the cab driver, 40% of the usual conventions have cancelled this year, so the area is surviving on tourism. We stayed at the Luxor for $69 a night, and although it was a tower room, it was a deal.

The Luxor is my favorite hotel on the strip. It is not the nicest or the most luxurious, but think about it – it had to have been built by a geek. If I was given a boatload of money and told to build something impressive in the desert, it would be a pyramid. Plus at night its blackness contrasts well with the brightness of the other hotels, even with the sides having been given over to advertising.

However, one of the Luxor’s main acts is Carrot Top, and the dude is just scary looking. His face is everywhere you go in the hotel, even on the keys and the “do not disturb” signs, and it gets creepy after awhile.

Back to Interop: the show had most of the people you would expect. We stopped by the HP booth to look at the latest OpenView. HP must be doing well, because they had some seriously thick padding under the booth carpet, which was awesome (if you have ever worked a show on a concrete floor for a couple of days, you know what I am talking about). I decided to talk a little smack to their folks in the booth. I thanked them for raising their prices so drastically since it helped us out, which caused them to asked about OpenNMS. When I told them it was an open source network management platform, the reply was “yes, but OpenView is for the enterprise.”.

I took that as my cue to bring up that we have customers monitoring over 55,000 devices with OpenNMS (them: “with a single instance?”, me: “yup”) and that we were replacing OpenView at a client in Italy because their devices, which have more than 32,000 interfaces each, break OpenView but work with us. Things got quiet and a little awkward after that, so we left (but the lady kept my card).

Microsoft was a no-show (or at least I didn’t see their booth), but I did get introduced to a company called Xirrus. Xirrus builds wireless arrays that have a high level of built in switching, and their marketing pitch was a face-off between their wireless “switches” and wired ones. They had a boxing ring in the middle of the booth and several times a day held actual bouts. When it wasn’t being used by humans, one corner held your traditional network switch (with lots cables of course), and the other corner held a Xirrus array.

The arrays looked like big roombas with RJ-45 connections, and they had really cool lights (Jeff took a video).

All in all it was a fun time, mainly because we got hang “backstage” with people who really seemed to both love networking as well as knowing a lot about it. What did surprise me were the number of people that were using OpenNMS. When we’d get introduced we were often met with “Oh, we use OpenNMS. It’s great.”

It’s nice to hear. While we have things like the Order of the Blue Polo and the Wall of Cards, we rarely hear from people who use the tool outside of our clients. And while we love our clients, usually when we hear from them it is to ask a question or report a problem. We work hard to make OpenNMS great while remaining 100% open source so it definitely motivates us to meet people who find it useful.

It was a little sad when the show ended and the equipment started coming down. Perhaps we can return next year.

Twitter Outage

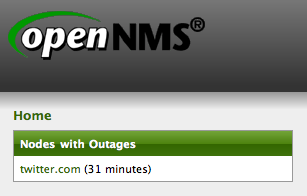
There is currently a Twitter outage going on:

However, Jeff thought it would be cool to monitor Twitter, so we all got notified.

Cool, huh? And we’ll know pretty soon after it comes back up.

NOTE: It actually came back up as I was typing this and I got the RESOLVED message. So much fun with network management.

Why People Need Support

I like to think that the people who use our services get value for their money, but I sure many more ask the question “why do I even need support?”

At OpenNMS, we don’t sell software (all our software is free). I like to say we sell time. At the moment, anyone who has found out about OpenNMS, installed it and decided to use it obviously possesses well above average intelligence, impeccable taste and is most likely devilishly attractive. They are capable of figuring out issues without a support contract, either by experimentation, using the free resources such as the mailing lists, or both. But do they have the time?

Normally, most of the trouble tickets we get concern configuration, a few involve actual bugs with OpenNMS itself, and more than you would think are the result of vendors not honoring standards. We spend a lot of time figuring out issues with things like poorly written SNMP agents and even operating system problems.

And then there are the bad MIBs.

Recently I got an e-mail from a person who uses the Anevia Flamingo product. They wanted some help using mib2opennms to convert Flamingo SNMP traps into a format they could use.

Usually I have to politely decline helping people who contact me privately about OpenNMS issues. It wouldn’t be fair to our paying clients if I spent time helping people one-on-one for free, so I point them to free resources like the mailing lists. When I have time I try to help out there, as that gets archived publicly and might help others. The catch is that you may or may not get a timely answer to your question on the list, whereas you can always pester us about support tickets.

But this question involved mib2opennms. I’ve been using that tool for six years and my mib2opennms-fu is strong, so I took the Anevia MIB I was sent, cranked it through the tool and sent back the output.

I received a reply that it wasn’t working and the user was still getting unformatted trap errors like:

Received unformatted enterprise event (enterprise:.
1.3.6.1.4.1.20967.1.12.1.30 generic:6 specific:2). 3 args: .
1.3.6.1.4.1.20967.1.12.1.30="" .1.3.6.1.4.1.20967.1.12.1.30.1="1" .
1.3.6.1.4.1.20967.1.12.1.30.2="10.180.1.232"

I went into the file I had created and noticed that the enterprise id was missing the last “.30”, which is why it wasn’t matching, so it was off to look at the MIB.

It started off normally enough, with some object definitions:

anevia OBJECT IDENTIFIER ::= { enterprises 20967 }
anevia1 OBJECT IDENTIFIER ::= { anevia 1 }
tsnmp OBJECT IDENTIFIER ::= { anevia1 1 }
manager OBJECT IDENTIFIER ::= { anevia1 12 }
aneviaManager1 OBJECT IDENTIFIER ::= { manager 1 }
aneviaManagerTraps1 OBJECT IDENTIFIER ::= { aneviaManager1 30 }

and then later in the MIB came the trap:

inputDownTrap TRAP-TYPE
  ENTERPRISE aneviaManager1
  VARIABLES { streamerInputIndex, streamerAddress }
  DESCRIPTION
    "This trap is sent when an input on a streamer becomes unavailable,
     and can no longer provide any useful data, the provided index is the
     index of this input."
  ::= 2

At least the mystery of the missing “.30” was solved. The “ENTERPRISE” value for this trap should be “aneviaManagerTraps1” instead of “aneviaManager1”. Easy enough to fix. But then I noticed that instead of the two varbinds listed in the MIB, the agent was sending three (see above) where the first one was blank (as well as being just the enterprise OID).

Grrrr.

The second varbind value of “1” could easily be the streamerInputIndex and “10.180.1.232” could be the streamerAddress but these won’t be correctly reflected in the events file since they’re off by one due to the mystery blank initial varbind.

This is the case of a poorly written MIB and a poorly implemented agent, and there is little we can do about it but work around it in configuration. I asked the user to make sure we had the latest Anevia MIB and was told we did. I wrote Anevia support but since I don’t have a relationship with them I never got a reply.

This happens way more than you might imagine, and we’ve gained a lot of experience in diagnosing and either correcting or working around such issues. Because we’ve seen stuff like this before, we can do this quickly, which is why I like to say I sell time. It only takes a few issues like this to have a support subscription pay for itself.

[Note: This post isn’t meant to be a pitch for services but a rant about the time I wasted playing with the Anevia MIB, but if it helps sell a support contract, that’s cool too (grin)]