Just a quick note that my latest “Open for Business” article, this time on marketing, is available on opensource.com.
Month: October 2010
OpenNMS Meet-Up in Portland, Oregon on Wed, 27 Oct
I’ll be in Portland for GOSCON this week, so I wanted to invite any area OpenNMS users to meet up at Henry’s Tavern at 7pm on Wednesday. Drop me a note if you think you can make it so I know how many seats to reserve.
Open Source Economics
The following is a TED talk on “Open Source Economics” by Yochai Benkler. It’s a little dated (it is from 2005) but still relevant. I do like his term “social production”.
(Hat tip: Matt Raykowski)
The Update Service
I’m a bit of a security nut. I encrypt my hard drives on laptops, I prefer using mail with GPG, I set up all my network services to work over SSL, etc.
But one area I’ve always been a bit slack on is in updating software. Sure, I get graphical reminders on my desktop, so that’s a no brainer, but what about the 30 or so servers we use at The OpenNMS Group?
Now, granted, most of the security issues that arise from the operating systems I use tend to be local exploits, and I trust anyone who has local access to any of my machines, but still, I thought it would be nice to have some sort of notice that one of my machines needed to update its software.
Enter OpenNMS.
We use three main operating systems: CentOS, Debian and OS X. All three of them have a package management system, each with its own set of commands. I figured I could write a short script for each one that would tell me if there were packages that needed updating.
For CentOS, I used “yum check-update”, specifically:
# cat crons/update.sh
#!/bin/bash

yum check-update 2>/dev/null | grep -v Load | grep -v * | grep -v '^$'
    | wc -l > /root/var/updatestatus.txt
This should output the number of packages needing to be updated, and the “grep -v” statement remove some of the formatting lines. For those of you wondering about the “updatestatus.txt: bit, read on.
For Debian, I used “apt-get upgrade”, but there were a few caveats:
# cat crons/update.sh
#!/bin/bash

apt-get update > /dev/null 2>&1

ISZERO=`apt-get -s upgrade
   | grep 0 upgraded, 0 newly installed, 0 to remove and 0 not upgraded | wc -l`
if [ $ISZERO -eq 1 ] ; then
    echo 0 > /root/var/updatestatus.txt
    exit 0
fi

echo 1 > /root/var/updatestatus.txt
The first thing I needed to do is run an “apt-get update” followed by an “apt-get -s upgrade” (the -s just simulates the upgrade as I didn’t want to actually perform it without human review). Unlike the “yum” command above, I didn’t take the time to return a number indicating the number of packages that should be upgraded, instead I just return a “1” if that number isn’t zero.
Finally, for OS X:
$ cat crons/update.sh
#!/bin/bash

ISZERO=`/usr/sbin/softwareupdate -l 2>/dev/null | grep * | wc -l`

echo $ISZERO > /Users/admin/var/updatestatus.txt
Here I used the “softwareupdate” command to list the packages that need updating, removing formatting lines.
So now I had a single script on all three operating systems that would return a non-zero number when updates are available.
The question is how to run it. Some monitoring systems might use ssh. But that presents maintenance, security, and performance issues. You first have to configure keys for each of your systems so that the monitoring server can access the remote system to run the command. This in turn opens up a security issue as now there is a new possibility for bad guys to get local access to the machine (and remember, 99% of the security updates you install are related to local exploits). Finally, doing a lot of ssh commands at scale puts an incredible load on the monitoring server.
I prefer to use Net-SNMP. It’s included in all three operating systems, which means the configuration is basically the same, and it is secure and high performance.
In order to have Net-SNMP run my script I used the “extend” directive in the “/etc/snmp/snmpd.conf” file:
extend update /root/crons/update.sh
This will add a table entry into the “nsExtendTable” called “update”. The OID will include “117.112.100.97.116.101” which is the decimal values for “u”, “p”, “d”, “a”, “t” and “e”.
Now these commands can take some time to run, so I didn’t want someone doing a lot of SNMPGET commands being able to DOS my system, so I looked at this value:
NET-SNMP-EXTEND-MIB::nsExtendCacheTime."update" = INTEGER: 5
which in numbers is:
.1.3.6.1.4.1.8072.1.3.2.2.1.5.6.117.112.100.97.116.101 = INTEGER: 5
and decided to increase it. By default, Net-SNMP will cache commands for five seconds. I thought it’d be cooler to cache it for, like, five minutes.
Unfortunately, you can’t set the cache time in the configuration, so I set up a read-only user:
com2sec rwUser 127.0.0.1 WonceRmany
That only ran from localhost, and then I could set the value:
snmpset -v1 -c WonceRmany localhost .1.3.6.1.4.1.8072.1.3.2.2.1.5.6.117.112.100.97.116.101 i 300
This works fine, until you restart. Then it gets reset (which is why I’d love to have it in the config itself). But I figured I could always edit the “snmpd” init script to run the set for me, but another problem arose.
These checks can take a long time to execute – 30 seconds to a minute or more. Running them via an SNMPGET will always cause the GET to timeout. Plus, on some machines, running these commands requires special privileges, so instead of mucking around getting the Net-SNMP permission, I opted for a simpler method.
I set up a cron to run every hour that would run this command and dump the output to /root/var/updatestatus.txt (you could put it anywhere you like, of course). Then I just had Net-SNMP check that file:
extend update /bin/cat /root/var/updatestatus.txt
An example cron for a CentOS machine:
10 * * * * /root/crons/update.sh
I decided on once an hour because I could stagger when the cron ran across my machines so I wouldn’t have a bunch happening at once.
This works surprisingly well – sometimes too well, in fact, since there can be several one or two package updates each week. It’s also funny to watch the updates come in, since each system seems to have a different preferred mirror and it can take hours before the different mirrors see the update.
The only downside to this method is that since the cron only runs once an hour, once the update is completed the service will remain down an hour before coming back up. You can prevent this by manually running the update script after doing the update, if you so choose, or just dumping a zero into the update file.
Bringing it all together, so now I have the following:
NET-SNMP-EXTEND-MIB::nsExtendCommand."update" = STRING: /bin/cat
NET-SNMP-EXTEND-MIB::nsExtendArgs."update" = STRING: /root/var/updatestatus.txt
NET-SNMP-EXTEND-MIB::nsExtendInput."update" = STRING:
NET-SNMP-EXTEND-MIB::nsExtendCacheTime."update" = INTEGER: 5
NET-SNMP-EXTEND-MIB::nsExtendExecType."update" = INTEGER: exec(1)
NET-SNMP-EXTEND-MIB::nsExtendRunType."update" = INTEGER: run-on-read(1)
NET-SNMP-EXTEND-MIB::nsExtendStorage."update" = INTEGER: permanent(4)
NET-SNMP-EXTEND-MIB::nsExtendStatus."update" = INTEGER: active(1)
NET-SNMP-EXTEND-MIB::nsExtendOutput1Line."update" = STRING: 0
NET-SNMP-EXTEND-MIB::nsExtendOutputFull."update" = STRING: 0
NET-SNMP-EXTEND-MIB::nsExtendOutNumLines."update" = INTEGER: 1
NET-SNMP-EXTEND-MIB::nsExtendResult."update" = INTEGER: 0
NET-SNMP-EXTEND-MIB::nsExtendOutLine."update".1 = STRING: 0
or with numbers:
.1.3.6.1.4.1.8072.1.3.2.2.1.2.6.117.112.100.97.116.101 = STRING: /bin/cat
.1.3.6.1.4.1.8072.1.3.2.2.1.3.6.117.112.100.97.116.101 = STRING: /root/var/updatestatus.txt
.1.3.6.1.4.1.8072.1.3.2.2.1.4.6.117.112.100.97.116.101 = STRING:
.1.3.6.1.4.1.8072.1.3.2.2.1.5.6.117.112.100.97.116.101 = INTEGER: 5
.1.3.6.1.4.1.8072.1.3.2.2.1.6.6.117.112.100.97.116.101 = INTEGER: exec(1)
.1.3.6.1.4.1.8072.1.3.2.2.1.7.6.117.112.100.97.116.101 = INTEGER: run-on-read(1)
.1.3.6.1.4.1.8072.1.3.2.2.1.20.6.117.112.100.97.116.101 = INTEGER: permanent(4)
.1.3.6.1.4.1.8072.1.3.2.2.1.21.6.117.112.100.97.116.101 = INTEGER: active(1)
.1.3.6.1.4.1.8072.1.3.2.3.1.1.6.117.112.100.97.116.101 = STRING: 0
.1.3.6.1.4.1.8072.1.3.2.3.1.2.6.117.112.100.97.116.101 = STRING: 0
.1.3.6.1.4.1.8072.1.3.2.3.1.3.6.117.112.100.97.116.101 = INTEGER: 1
.1.3.6.1.4.1.8072.1.3.2.3.1.4.6.117.112.100.97.116.101 = INTEGER: 0
.1.3.6.1.4.1.8072.1.3.2.4.1.2.6.117.112.100.97.116.101.1 = STRING: 0
So now I just configure the OpenNMS system to test for the existence of “.1.3.6.1.4.1.8072.1.3.2.4.1.2.6.117.112.100.97.116.101.1” in either capsd:
    <protocol-plugin protocol="Update"
             class-name="org.opennms.netmgt.capsd.plugins.SnmpPlugin" scan="on">
        <property key="vbname" value=".1.3.6.1.4.1.8072.1.3.2.4.1.2.6.117.112.100.97.116.101.1" />
        <property key="timeout" value="3000" />
        <property key="retry" value="1" />
    </protocol-plugin>
Or in the default foreign source in the provisioner:

And then I add it to the poller configuration:
    <package name="custom">
        <filter>IPADDR != '0.0.0.0'</filter>
        <rrd step="300">
            <rra xmlns="">RRA:AVERAGE:0.5:1:2016</rra>
            <rra xmlns="">RRA:AVERAGE:0.5:12:1488</rra>
            <rra xmlns="">RRA:AVERAGE:0.5:288:366</rra>
            <rra xmlns="">RRA:MAX:0.5:288:366</rra>
            <rra xmlns="">RRA:MIN:0.5:288:366</rra>
        </rrd>
        <service name="Update" interval="300000" user-defined="true" status="on">
            <parameter key="retry" value="1"/>
            <parameter key="timeout" value="3000"/>
            <parameter key="port" value="161"/>
            <parameter key="oid" value=".1.3.6.1.4.1.8072.1.3.2.4.1.2.6.117.112.100.97.116.101.1"/>
            <parameter key="operator" value="<"/>
            <parameter key="operand" value="1"/>
        </service>
        <downtime begin="0" end="300000" interval="30000"/>
        <downtime begin="300000" end="43200000" interval="300000"/>
        <downtime begin="43200000" interval="600000"/>
    </package>
and don’t forget the “monitor” line at the bottom:
<monitor service="Update" class-name="org.opennms.netmgt.poller.monitors.SnmpMonitor"/>
Note that I stuck this monitor in its own package. This is a best practice when using OpenNMS. If you place all of your customizations in to separate packages and leave the default configurations in place, upgrades become much easier.
I hope at least one of my three readers found this useful, and I hope it gives you some other ideas on integrating your IT information under one roof with OpenNMS.
OpenNMS and Fluke Networks
Having started out in the telecom industry (back when it was different from datacom – yes, I know, I’m old) I was always a fan of Fluke test gear, so I find it kind of amusing that they’ve decided to pick on OpenNMS to promote their latest commercial network management tool, OptiView.
I didn’t even know Fluke was in the network management business, so I was surprised when someone sent me a link to their website in which they feature part of an OpenNMS screenshot as their “wrong way” example.
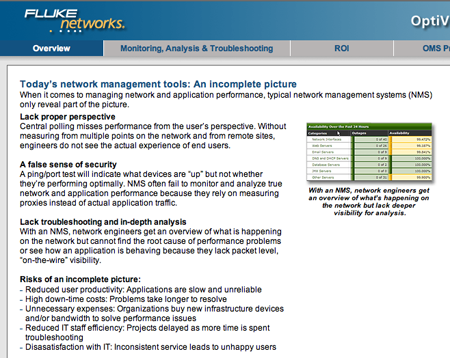
I’m pretty certain they just grabbed this image off of the web because the text of the page could read as an advertisement for OpenNMS. They obviously didn’t do their homework. I thought it would be a fun exercise to examine their claims in the context of our project.
Lack of Proper Perspective
In this paragraph they state “Central polling misses performance from the user’s perspective”. This is true, and it is why OpenNMS has a remote poller that performs synthetic transactions from the point of view of remote end users and integrates with most popular mapping software so that engineers can easily pinpoint problems. This is in use at nearly 3000 sites worldwide for Papa Johns Pizza – it would be interesting to know if Fluke has an install on that scale, and if so, how much it would cost.
A False Sense of Security
They lost me a little on this one, but they seem to be saying “our monitoring is better than your monitoring”. OpenNMS has multiple levels of monitors, from simple ping/port checks up to capturing the full user experience with the Page Sequence Monitor and the Mail Transport Monitor. When OpenNMS polls for service assurance, it is, for all practical purposes, a user of network services and it reports back what a user would experience.
Lack Troubleshooting and In-depth Analysis
This section states the need for root cause analysis and “packet-level ‘on-the-wire’ visibility.
Well, as for root cause, OpenNMS duplicates the functionality of such classic management products as Netcool/Omnibus and Netcool/Impact, so I’m pretty certain it can address whatever it is OptiView claims to do.
As for packet-level inspection, this is one area that OpenNMS does not cover. One of the reasons is that with today’s large and distributed networks, it is not feasible to monitor every single packet on the network. What OpenNMS does do is indicate areas where there are problems, and then engineers can take their packet sniffer and investigate further. We often use Wireshark in diagnosing customer issues, once OpenNMS determines the part of the network needing attention.
Risks of an Incomplete Picture
This list of bullet points is pretty valid, but the assumption that tools like OpenNMS provide “an incomplete picture” is patently false. I tried to download their “NMS Risks & Shortcomings” white paper but got an error message “This area of the site is temporarily unavailable.” Heh.

This is typical FUD from a commercial company trying, and failing, to differentiate itself from other underpowered and overpriced commercial software tools.
But I must say I’m somewhat flattered by this since our goal with the OpenNMS project is to make every decision about a network management solution to include the question “Why aren’t you using OpenNMS?”
I’m hoping than everyone who might find this site asks themselves the same thing.
OpenNMS and the City of Portland
Oregon is probably the leading state when it comes to using open source software in government, so it is not unexpected to see that at the end of the month they are holding a Government in Open Source Conference.
One of our clients, The City of Portland, will be doing a presentation on OpenNMS. From the program:
The City of Portland has recently implemented open source network and system monitoring using OpenNMS. Currently this is deployed for a City operated network serving external customer agencies including schools and government. OpenNMS was successfully deployed with some customization to allow customers to see web pages of traffic statistics for their network links only. City network staff have full access to all OpenNMS data and functionality. The City is planning to expand the deployment of OpenNMS to monitor network and servers on the City’s production business networks. This session will focus on the challenges and decisions leading to the selection of OpenNMS, as well as an overview of the implementation to date.
OpenNMS allows one to both improve on existing network management infrastructure while cutting costs. In these times, especially in government, this is a Good Thing™.
A Little Microsoft and VMWare Rant
I’m out at a customer site this week, and while the customer is awesome, a couple of things have made me very frustrated.
The first concerns Windows Management Instrumentation (WMI). OpenNMS now supports native WMI (thanks mainly to Matt Raykowski) and this is the first time I got to play with it. Works like a charm and how you would expect with OpenNMS – simply. I edited wmi-config.xml, put in a valid username and password, edited capsd-configuration.xml to discover WMI, and turned it on in collectd-configuration.xml. Restart, and now I’m collecting a ton of WMI stats out of the box.
So far, so good.
One of their concerns is monitoring Exchange 2007. So I think, great, I’ll just configure some WMI classes and objects dealing with Exchange, make some graphs, and we’re done.
Not so fast.
First, there doesn’t seem to be a good place to get a list of all the available WMI classes easily. I did find some rather thick Technet docs, but for the most part it is a lot of digging. It would be nice if there was a MIB-like document that described them.
Second, it turns out that Exchange 2007 doesn’t support WMI. You have to use Powershell “cmdlets” and script it from there.
What?
Okay, so Microsoft decides that SNMP isn’t good enough to use for exchanging data between a manager and an agent, so they invent their own management protocol called WMI, and a few years later decide it isn’t worth supporting.
(sigh)
My second source of frustration deals with VMWare. The client currently uses ESX, so I’m like – hey, just go in, enable the Net-SNMP agent, enable the “dlmod” for the ESX MIB and we’re set.
That is all well and good, but they are migrating everything to ESXi which, wait for it, doesn’t support SNMP. Well, at least GETs.
From the VMWare documentation (PDF), you first get:
… hardware monitoring through SNMP continues to be supported by ESXi, and any third-party management application that supports SNMP can be used to monitor it. For example, Dell OpenManage IT Assistant (version 8.1 or later) has ESXi MIBs pre-compiled and integrated, allowing basic inventory of the server and making it possible to monitor hardware alerts such as a failed power supply. SNMP also lets you monitor aspects of the state of the VMkernel, such as resource usage, as well as the state of virtual machines.
Okay, good, but the next paragraph reads
ESXi ships with an SNMP management agent different from the one that runs in the service console of ESX 3. Currently, the ESXi SNMP agent supports only SNMP traps, not gets.
Again, what?
I mean, okay, traps are great, but how am I supposed to monitor “resource usage” if I can’t do a GET?
In both cases there does exist a non-standard, proprietary API that can be used to mine this data, and if the demand is high enough we’ll definitely put it into OpenNMS. Thank goodness the architecture is abstracted so that it is easy to add such plugins without having to re-write everything.
But, c’mon people, we have standards for a reason. Can’t we all just get along?
95th Percentile
I am happy to announce that Jeff Gehlbach, over the weekend, managed to close an outstanding feature request that has been around for several years now.
Many moons ago we added support for JRobin to OpenNMS. JRobin is a Java port of RRDtool 1.0 and was developed by Sasa Markovic. When Sasa decided to no longer work on the library, he donated it to the OpenNMS Project.
Unfortunately, we haven’t had the resources to improve it much, so a number of features in future RRDtool releases have not been backported into JRobin. One useful one was the VDEF directive. In RRDtool, VDEFs allow one to work on the entire dataset instead of each value in the array.
The VDEF command allows for the calculation of such things as 95th Percentile. This is a method often used to calculate a value for billing burstable resources, such as network bandwidth, where the system can support short bursts above a committed rate without impacting the system. Basically, it is a number that says “95% of the time, the usage is at or below this amount“.
With Jeff’s change, this is now possible to do with JRobin. Since it is an operation on existing data, no change is required to the RRD files themselves, and it can be added simply by changing the snmp-graph.properties file.
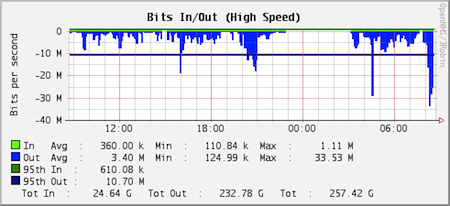
This is a graph of the traffic from www.opennms.org. As you can see, the average outbound traffic is 3.40 Mbps with a peak of 33.53 Mbps. The 95th percentile, however, is only 10.70 Mbps, which is less than a third of the max. This calculation gets rid of the spiky bits while providing a more useful value for utilization.
The change will be in the next stable and unstable releases, and can be used now with the nightly snapshots.
Note: Here is the code used to generate the graph above.
report.mib2.HCbits.name=Bits In/Out

report.mib2.HCbits.columns=ifHCInOctets,ifHCOutOctets

report.mib2.HCbits.type=interfaceSnmp

report.mib2.HCbits.command=--title="Bits In/Out"

DEF:octIn={rrd1}:ifHCInOctets:AVERAGE

DEF:octOut={rrd2}:ifHCOutOctets:AVERAGE

CDEF:rawbitsIn=octIn,8,*

CDEF:rawbitsOut=octOut,8,*

CDEF:rawtotBits=octIn,octOut,+,8,*

CDEF:bitsIn=rawbitsIn,UN,0,rawbitsIn,IF

CDEF:bitsOut=rawbitsOut,UN,0,rawbitsOut,IF

CDEF:bitsOutNeg=0,bitsOut,-

CDEF:totBits=rawtotBits,UN,0,rawtotBits,IF

CDEF:outSum=bitsOut,{diffTime},*

CDEF:inSum=bitsIn,{diffTime},*

CDEF:totSum=totBits,{diffTime},*

VDEF:outpct=bitsOut,95,PERCENT

VDEF:inpct=bitsIn,95,PERCENT

GPRINT:totBits:AVERAGE:" Avg  \: %8.2lf %s\n"

LINE2:rawbitsIn#00ff00:"Bits In"

GPRINT:rawbitsIn:AVERAGE:" Avg  \: %8.2lf %s"

GPRINT:rawbitsIn:MIN:"Min  \: %8.2lf %s"

GPRINT:rawbitsIn:MAX:"Max  \: %8.2lf %s\n"

LINE2:rawbitsOut#0000ff:"Bits Out"

GPRINT:rawbitsOut:AVERAGE:"Avg  \: %8.2lf %s"

GPRINT:rawbitsOut:MIN:"Min  \: %8.2lf %s"

GPRINT:rawbitsOut:MAX:"Max  \: %8.2lf %s\n"

LINE2:outpct#000077:"95 pct out"

GPRINT:outpct:" \: %8.2lf %s\n"

LINE2:inpct#007700:"95 pct in"

GPRINT:inpct:"  \: %8.2lf %s\n"

GPRINT:inSum:AVERAGE:"  Tot In  \: %8.2lf %s"

GPRINT:outSum:AVERAGE:" Tot Out  \: %8.2lf %s"

GPRINT:totSum:AVERAGE:" Tot  \: %8.2lf %s\n"