This morning we were trying to set up a GoToMeeting so that Jay could demo the new JasperReports integration into OpenNMS (for those of you playing at home it should be merged into trunk this afternoon).
We couldn’t authenticate.
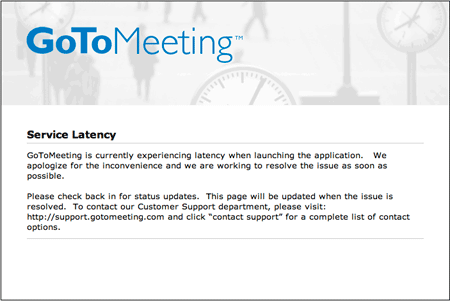
The http://status.gotomeeting.com site displayed the following:
Whenever I have an issue with a network resource, my first reaction is to get OpenNMS to monitor it.
With many monitoring tools, there is a lot of talk about “plugins”. In yesterday’s post about Nagios, one of the reasons it is so popular is that it is really easy to add custom scripts.
But there is a downside. Since it is so easy to add code, it is much harder to insure that the plugins both perform well with respect to scaling and that they are secure.
This is one of the reasons we build in very generic monitors and data collectors into OpenNMS versus having an open plugin architecture (for example, recently Slashdot had an article claiming that “insecure plugins are a serious threat to all browsers“). The idea is that you should be able to do much of what you need simply by configuring, or at the most modifying, an existing monitor, and those monitors are designed to scale.
I remember at one client they were using Nagios and they had a check script that made a number of SNMP queries to determine the status of RAID controllers on Dell servers. I ported the script to OpenNMS using the general purpose monitor, we pointed it at the entire network (previously, they had only used it on a small number of servers) and went to lunch.
When we came back, the system had automatically discovered over 1400 servers and the load was around 20 (on a pretty powerful box). This wouldn’t do, so we rewrote the script by modifying the existing SNMP monitor to duplicate this functionality (these became the PERC and OMSA monitors). After we switched, the load on the system was less than 1. All of those fork-exec calls were killing the system.
Well, back to GoToMeeting. Once their system was back to normal, the status page looked something like this:
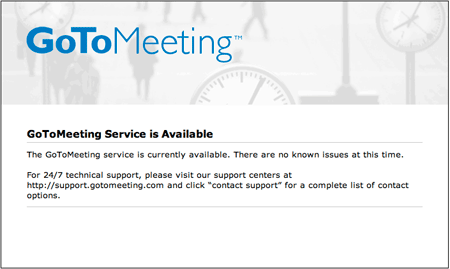
I decided that it would be pretty easy to use the Page Sequence Monitor to test for the string “The GoToMeeting service is currently available”. If that string was on the page, I will assume the service is up.
First, I added the service to the capsd-configuration.xml file:
<protocol-plugin protocol="Go2Status"
     class-name="org.opennms.netmgt.capsd.plugins.LoopPlugin"
     scan="off" user-defined="false" />
I used the LoopBack plugin since I had decided to manually add the service to the GoToMeeting node, so I had no need for automatic discovery.
Then I added it to the poller-configuration.xml file:
<service name="Go2Status" interval="300000" user-defined="true" status="on">
    <parameter key="retry" value="1"/>
    <parameter key="timeout" value="5000"/>
    <parameter key="page-sequence">
      <page-sequence>
        <page path="/"
            port="80"
            virtual-host="status.gotomeeting.com"
            successMatch=
                 "(?s).*The GoToMeeting service is currently available.*" />
      </page-sequence>
    </parameter>
</service>
(don’t forget to add the monitor tag at the bottom)
<monitor service="Go2Status"
     class-name="org.opennms.netmgt.poller.monitors.PageSequenceMonitor"/>
And finally, I used the provisioner to add it to the IP address for “status.gotomeeting.com”:
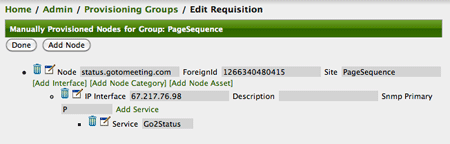
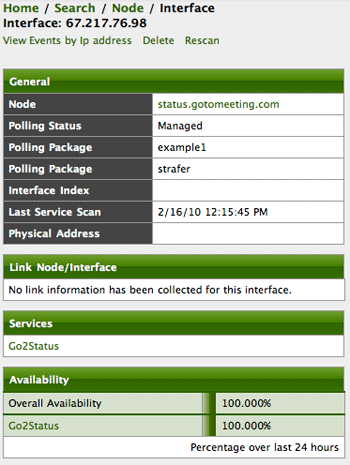
Voila! I now have a monitor that I know is secure and will perform well and I was able to do this strictly through configuration.
By leveraging the existing monitors and collectors in OpenNMS, sometimes augmented by agent technology such as Net-SNMP, it is quite easy to extend OpenNMS without the need to introduce variables that could degrade either security (such as using ssh and shared keys to access remote hosts) or performance (such as running scripts that require a shell).