I often talk about how OpenNMS is a platform and not just an application, and with the release of OpenNMS 14 there is a lovely way to demonstrate the difference.
There is a cool little GUI improvement that I believe was started at last year’s Dev Jam which provides graphical timeline for outages. So now instead of having to look at the outage table on a node’s page, you can just look at the service availability section.
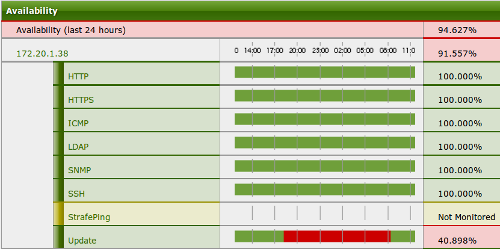
Cool, huh? What you may not realize is that instead of hardcoding the feature the timelines are rendered through ReST. The GUI sends a ReST request to the server which returns the graphic information. Let’s examine the “Update” service above.
The query
/opennms/rest/timeline/image/46/172.20.1.38/Update/1415119622/1415206023/480
results in:

with a format of:
/opennms/rest/timeline/image/{nodeId}/{ipAddress}/{serviceName}/{start}/{end}/{width}
Even the header graphic is done the same way
/opennms/rest/timeline/header/1415119622/1415206023/480
results in:

with a format of:
/opennms/rest/timeline/header/{start}/{end}/{width}
Of course, assembling all of that can be tedious, so this query:
/opennms/rest/timeline/html/46/172.20.1.38/Update/1415119622/1415206023/480
with a format of:
/opennms/rest/timeline/html/{nodeId}/{ipAddress}/{serviceName}/{start}/{end}/{width}
will create the whole HTML code needed to render the timeline:
document.write('<img src="/opennms/rest/timeline/image/46/172.20.1.38/Update/1415119622/1415206023/480" usemap="#46-172.20.1.38-Update">
<map name="46-172.20.1.38-Update"><area shape="rect" coords="128,2,412,18" href="/opennms/outage/detail.htm?id=153740" alt="Id 153740"
title="2014-11-04 18:13:24.628"><area shape="rect" coords="-111,2,-26,18" href="/opennms/outage/detail.htm?id=153724" alt="Id 153724"
title="2014-11-04 06:12:56.322"><area shape="rect" coords="-2051,2,-1925,18" href="/opennms/outage/detail.htm?id=153348" alt="Id 153348"
title="2014-10-31 06:13:11.421"><area shape="rect" coords="-2291,2,-2291,18" href="/opennms/outage/detail.htm?id=153289" alt="Id 153289"
title="2014-10-30 18:11:33.006"><area shape="rect" coords="-2691,2,-2397,18" href="/opennms/outage/detail.htm?id=153258" alt="Id 153258"
title="2014-10-29 22:13:27.086"><area shape="rect" coords="-2871,2,-2871,18" href="/opennms/outage/detail.htm?id=153235" alt="Id 153235"
title="2014-10-29 13:12:29.747"><area shape="rect" coords="-3071,2,-2884,18" href="/opennms/outage/detail.htm?id=153137" alt="Id 153137"
title="2014-10-29 03:12:13.887"><area shape="rect" coords="-3232,2,-3231,18" href="/opennms/outage/detail.htm?id=153132" alt="Id 153132"
title="2014-10-28 19:11:02.873"><area shape="rect" coords="-3690,2,-3670,18" href="/opennms/outage/detail.htm?id=153086" alt="Id 153086"
title="2014-10-27 20:14:11.949"><area shape="rect" coords="-6431,2,-6431,18" href="/opennms/outage/detail.htm?id=152786" alt="Id 152786"
title="2014-10-22 03:11:05.149"></map>');
If a service isn’t monitored, such as the StrafePing service in the above example, that empty timeline is also available:
/opennms/rest/timeline/empty/1415119622/1415206023/480
![]()
with a format of:
/opennms/rest/timeline/empty/{start}/{end}/{width}
Pretty cool, huh? A lot of OpenNMS is accessible by ReST and the wiki page covers most of the options. Thus you can use the data via the OpenNMS GUI or integrate it with one of your own.