So, yes, the gang from OpenNMS will be at the SCaLE conference this weekend (I will not be there, unfortunately, due to a self-imposed conference hiatus this year). It should be a great time, and we are happy to be a Gold Sponsor.
But this post is not about that. This is about how Horizon 17 and data collection can scale. You can come by the booth at SCaLE and learn more about it, but here is the overview.
When OpenNMS first started, we leveraged the great application RRDTool for storing performance data. When we discovered a java port called JRobin, OpenNMS was modified to support that storage strategy as well.
Using a Round Robin database has a number of advantages. First, it’s compact. Once the file containing the RRD database is created, it never grows. Second, we used RRDTool to also graph the data.
However, there were problems. Many users had a need to store the raw collected data. RRDTool uses consolidation functions to store a time-series average. But the biggest issue was that writing lots of files required really fast hard drives. The more data you wanted to store, the greater your investment in disk arrays. Ultimately, you would hit a wall, which would require you to either reduce your data collection or partition out the data across multiple systems.
No more. With Horizon 17 OpenNMS fully supports a time-series database called Newts. Newts is built on Cassandra, and even a small Cassandra cluster can handle tens of thousands of inserts a second. Need more performance? Just add more nodes. Works across geographically distributed systems as well, so you get built-in high availability (something that was very difficult with RRDTool).
Just before Christmas I got to visit a customer on the Eastern Shore of Maryland. You wouldn’t think that location would be a hotbed of technical excellence, but it is rare that I get to work with such a quick team.
They brought me up for a “Getting to Know You” project. This is a two day engagement where we get to kick the tires on OpenNMS to see if it is a good fit. They had been using Zenoss Core (the free version) and they hit a wall. The features they wanted were all in the “enterprise” paid version and the free version just wouldn’t meet their needs. OpenNMS did, and being truly open source it fit their philosophy (and budget) much better.
This was a fun trip for me because they had already done most of the work. They had OpenNMS installed and monitoring their network, and they just needed me to help out on some interesting use cases.
One of their issues was the need to store a lot of performance data, and since I was eager to play with the Newts integration we decided to test it out.
In order to enable Newts, first you need a Cassandra cluster. It turns out that ScyllaDB works as well (more on that a bit later). If you are looking at the Newts website you can ignore the instructions on installing it as it it built directly into OpenNMS.
Another thing built in to OpenNMS is a new graphing library called Backshift. Since OpenNMS relied on RRDTool for graphing, a new data visualization tool was needed. Backshift leverages the RRDTool graphing syntax so your pre-defined graphs will work automatically. Note that some options, such as CANVAS colors, have not been implemented yet.
To switch to newts, in the opennms.properties file you’ll find a section:
###### Time Series Strategy ####
# Use this property to set the strategy used to persist and retrieve time series metrics:
# Supported values are:
#   rrd (default)
#   newts

org.opennms.timeseries.strategy=newts
Note: “rrd” strategy can refer to either JRobin or RRDTool, with JRobin as the default. This is set in rrd-configuration.properties.
The next section determines what will render the graphs.
###### Graphing #####
# Use this property to set the graph rendering engine type.  If set to 'auto', attempt
# to choose the appropriate backend depending on org.opennms.timeseries.strategy above.
# Supported values are:
#   auto (default)
#   png
#   placeholder
#   backshift
org.opennms.web.graphs.engine=auto
If you are using Newts, the “auto” setting will utilize Backshift but here is where you could set Backshift as the renderer even if you want to use an RRD strategy. You should try it out. It’s cool.
Finally, we come to the settings for Newts:
###### Newts #####
# Use these properties to configure persistence using Newts
# Note that Newts must be enabled using the 'org.opennms.timeseries.strategy' property
# for these to take effect.
#
org.opennms.newts.config.hostname=10.110.4.30,10.110.4.32
#org.opennms.newts.config.keyspace=newts
There are a lot of settings and most of those are described in the documentation, but in this case I wanted to demonstrate that you can point OpenNMS to multiple Cassandra instances. You can also set different keyspace names which allows multiple instances of OpenNMS to talk to the same Cassandra cluster and not share data.
From the “fine” documentation, they also recommend that you store the data based on the foreign source by setting this variable:
org.opennms.rrd.storeByForeignSource=true
I would recommend this if you are using provisiond and requisitions. If you are currently doing auto-discovery, then it may be better to reference it by nodeid, which is the default.
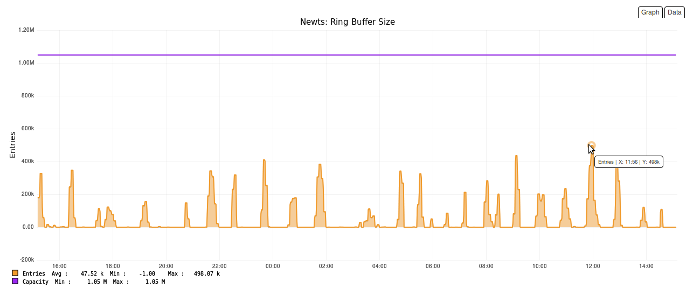
I want to point out two other values that will need to be increased from the defaults: org.opennms.newts.config.ring_buffer_size and org.opennms.newts.config.cache.max_entries. For this system they were both set to 1048576. The ring buffer is especially important since should it fill up, samples will be discarded.
So, how did it go? Well, after fixing a bug with the ring buffer, everything went well. That bug is one reason that features like this aren’t immediately included in Meridian. Luckily we were working with a client who was willing to let us investigate and correct the issue. By the time it hits Meridian 2016, it will be completely ready for production.
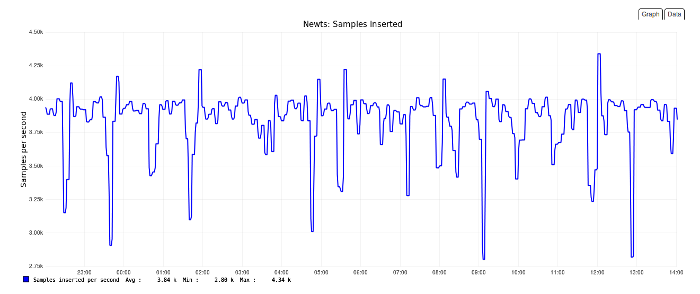
If you enable the OpenNMS-JVM service on your OpenNMS node, the system will automatically collected Newts performance data (assuming Newts is enabled). OpenNMS will also collect performance data from the Cassandra cluster including both general Cassandra metrics as well as Newts specific ones.
This system is connected to a two node Cassandra cluster and managing 3.8K inserts/sec.

If I’m doing the math correctly, since we collect values once every 300 seconds (5 minutes) by default, that’s 1.15 million data points, and the system isn’t even working hard.
OpenNMS will also collect on ring buffer information, and I took a screen shot to demonstrate Backshift, which displays the data point as you mouse over it.

Horizon 17 ships with a load testing program. For this cluster:
[root@nms stress]# java -jar target/newts-stress-jar-with-dependencies.jar INSERT -B 16 -n 32 -r 100 -m 1 -H cluster
-- Meters ----------------------------------------------------------------------
org.opennms.newts.stress.InsertDispatcher.samples
             count = 10512100
         mean rate = 51989.68 events/second
     1-minute rate = 51906.38 events/second
     5-minute rate = 38806.02 events/second
    15-minute rate = 31232.98 events/second
so there is plenty of room to grow. Need something faster? Just add more nodes. Or, you can switch to ScyllaDB which is a port of Cassandra written in C. When run against a four node ScyllaDB cluster the results were:
[root@nms stress]# java -jar target/newts-stress-jar-with-dependencies.jar INSERT -B 16 -n 32 -r 100 -m 1 -H cluster
-- Meters ----------------------------------------------------------------------
org.opennms.newts.stress.InsertDispatcher.samples
             count = 10512100
         mean rate = 89073.32 events/second
     1-minute rate = 88048.48 events/second
     5-minute rate = 85217.92 events/second
    15-minute rate = 84110.52 events/second
Unfortunately I do not have statistics for a four node Cassandra cluster to compare it directly with ScyllaDB.
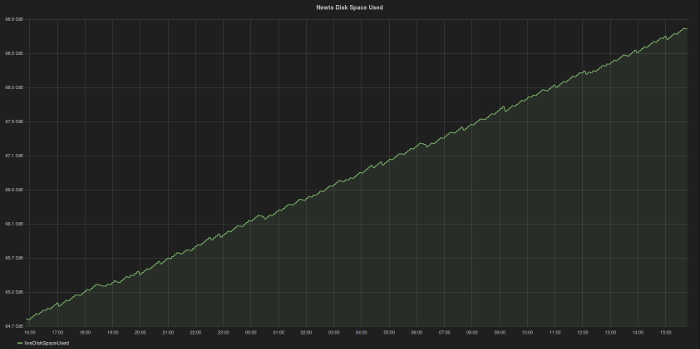
Of course the Newts data directly fits in with the OpenNMS Grafana integration.

Which brings me to one down side of this storage strategy. It’s fast, which means it isn’t compact. On this system the disk space is growing at about 4GB/day, which would be 1.5TB/year.

If you consider that the data is replicated across Cassandra nodes, you would need that amount of space on each one. Since the availability of multi-Terabyte drives is pretty common, this shouldn’t be a problem, but be sure to ask yourself if all the data you are collecting is really necessary. Just because you can collect the data doesn’t mean you should.
OpenNMS is finally to the point where the storing of performance data is no longer an issue. You are more likely to hit limits with the collector, which in part is going to be driven by the speed of the network. I’ve been in large data centers with hundreds of thousands of interfaces all with sub-millisecond latency. On that network, OpenNMS could collect on hundreds of millions of data points. On a network with lots of remote equipment, however, timeouts and delays will impact how much data OpenNMS could collect.
But with a little creativity, even that goes away. Think about it – with a common, decentralized data storage system like Cassandra, you could have multiple OpenNMS instances all talking to the same data store. If you have them share a common database, you can use collectd filters to spread data collection out over any number of machines. While this would take planning, it is doable today.
What about tomorrow? Well, Horizon 18 will introduce the OpenNMS Minion code. Minions will allow OpenNMS to scale horizontally and can be managed directly from OpenNMS – no configuration tricks needed. This will truly position OpenNMS for the Internet of Things.
UPDATE: Alejandro pointed out the following:
There is a property in OpenNMS for Newts that doesn’t appear in opennms.properties called heartbeat org.opennms.newts.query.heartbeat, which expects a duration in milliseconds. By default is 450000 (i.e. 1.5 x 5min) and it is used when no heartbeat is specified. Should generally be 1.5x your biggest collection interval.
If you were using 10 minute polls, set it to 15 min (1.5 x 10min), and then you will see graphs. To do this, add the following to opennms.properties and restart OpenNMS:
org.opennms.newts.query.heartbeat=900000