Things have been as busy and crazy as usual here in OpenNMS-land, so I often can’t find the time to talk about all the cool new shiny that is available. As my truck wouldn’t start this morning (it’s on the charger now) I thought I’d take some time to talk about a cool new plugin available since Horizon 16 was released.
One of the things I think will be needed in the next few years is a management platform that can scale to Internet of Things (IoT) levels. I also think that the only way to overcome the “Internet of Silos” effect will be to make that platform open source. I’d like OpenNMS to fill that role.
To that end we’re working on our “minion” project. These are lightweight remote processes that do data collection and monitoring and report up to a master OpenNMS instance, or even a cluster of OpenNMS management stations. In order to scale to the massive amounts of data generated by the IoT, we’ve created the Newts project to store time series data on top of Cassandra. Both of those projects are well under way and available for testing in various OpenNMS code branches.
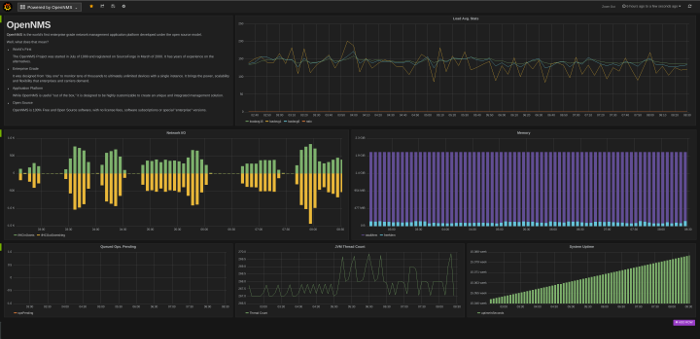
Then we were faced with how to display all of this information. Jesse decided to do an integration with the Grafana project, and now this functionality is available as a plug-in (click to embiggen):
It’s pretty cool – Jesse translates the syntax used for RRDTool reports into a form that Grafana can use, and since this is hosted on the Grafana server you can integrate data points from multiple OpenNMS instances or pretty much data from any source that Grafana can access. Details available on the Wiki.
Hat’s off to the Grafana project for making such a cool application, and as usual we hope you find this new addition to OpenNMS useful.
