For those three people who read this blog, I was wondering if you would mind posting the number of devices, interfaces and services you monitor with OpenNMS?
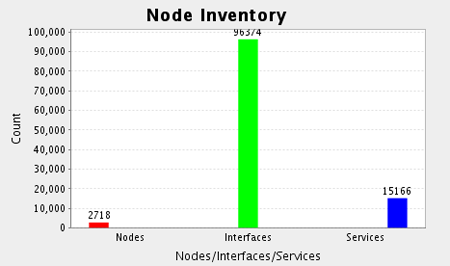
I’m in Chicago where the client has 2718 nodes and nearly 100,000 interfaces. The interfaces count is a little larger than we usually see, but the node count is on the low end of average.
I’m curious to know what others monitor with OpenNMS. I’ve asked Ben to consider making a little “OpenNMS Fan Club” app that people can optionally install that will send us this information anonymously, but he hasn’t had the time.
Oh, and Jeff has fixed the “clipping” issue on the chart in what will become 1.6.3.
My graph is similar- 2394 nodes, 101182 interfaces, 14264 services. 1 2x duocore/4GB server. App/Webapp/db on the same box, rrd collection, postgres db share the same volume. Disk is a large Hitachi SAN and opennms is getting high tier (15k rpm disks) storage.
I also run ziptie, wiki, and a couple other lightweight apps on the same box and share the postgres db with them.
Still have to add the 1500 or so servers in our enterprise. Nodes are primarily network devices.
I guess another important data point for scaling is we are actively collecting on 158,000 rrd files. Works out to a little more than 500 collections per second.
Database takes up 6.5GB (including the rather large ziptie db), rrds take up 12GB of space.