AWS
Conferences
Remaining 2022 Conferences
Conferences
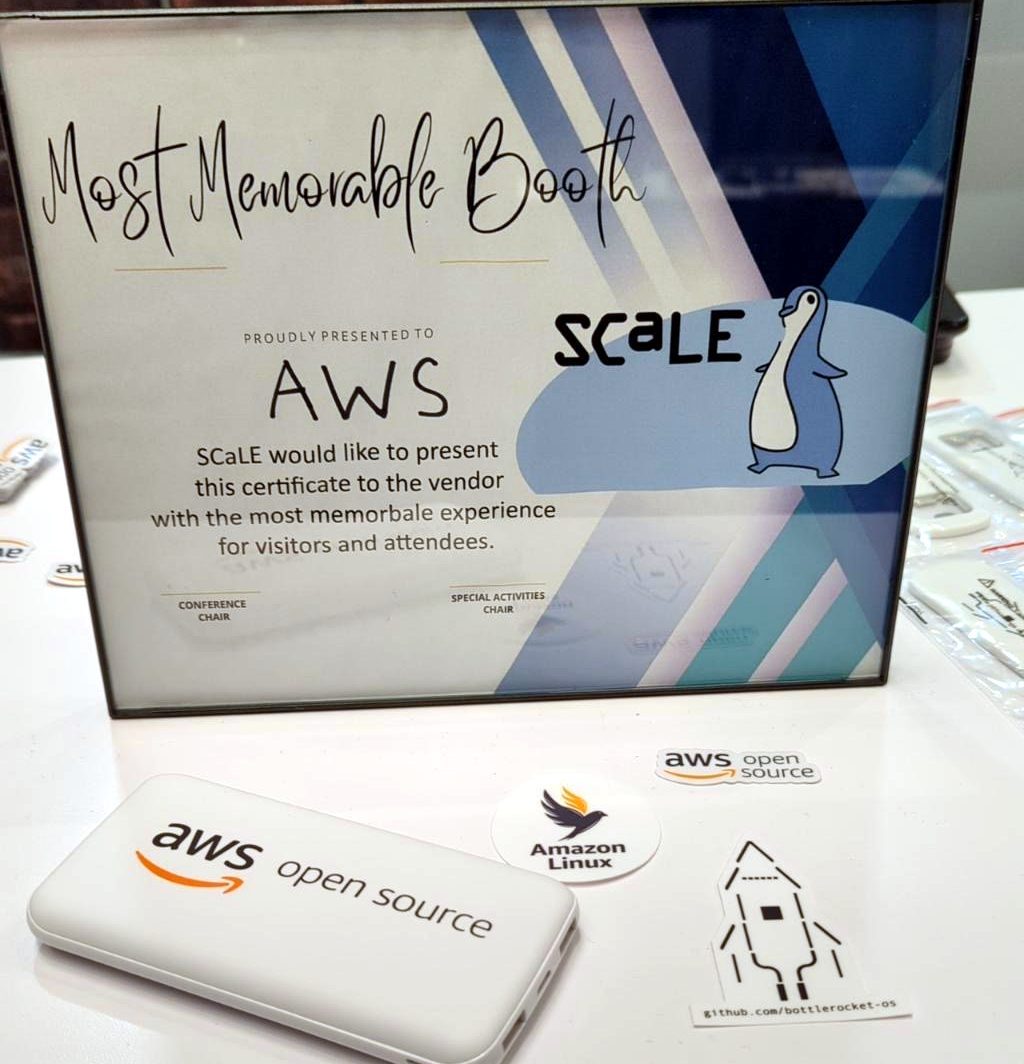
2022 SCaLE 19x – Day Four
Conferences
2022 SCaLE 19x – Day Three
Conferences
2022 SCaLE 19x – Day Two
Conferences
2022 Scale 19x – Day One
AWS
Conferences
Why You Should Attend SCaLE 19x
Conferences
2022 Open Source Summit – Day 4
Conferences
2022 Open Source Summit – Day 3
Conferences
2022 Open Source Summit – Day 2
Conferences
2022 Open Source Summit – Day 1
1
…
5
6
7
…
122