I am an rabid, drooling Net-SNMP fanboy. It is doubtful that OpenNMS would be able to do as much as it does without it.
While it generates stats like any other SNMP agent, the ability to extend the agent is what makes me love it. With just a small amount of configuration, I can get Net-SNMP to run commands locally and report back the results via SNMP. Thus it is real easy from me to gather data locally on each machine and send that information to OpenNMS, without the need of doing silly things like running a script using ssh. Since Net-SNMP even supports SNMPv3, the data can be secure.
Here’s an illustration.
On one of my servers I host a number of domains for friends and family. For some of those I simply forward all the mail I receive for that domain to, say, a RoadRunner account.
We ran into a problem where some of those addresses became the target of spammers. Since all my server does is relay the mail, Time Warner thought we were a spam server and blocked our IP. This caused the mail queue to get quite large. Had I not happened to look at the logs that day I wouldn’t have noticed.
We fixed the problem by creating IMAP mailboxes for those users on my server, but I wanted a way to be notified if the number of messages in the mail queue was high without having to look at log files.
The first thing I needed to do was find that information. On the server I can run “mailq” and get something at the end like
-- 23 Kbytes in 6 Requests.
which is a great start. I just need to parse out the “6” which I can do with
mailq | tail -n 1 | awk '{if (NF > 4) {print $5} else {print 0}}'
Note: above command improved by Alex Hoogerhuis – returns zero if there are no queued mails
Now that I have my value, I’ll wrap it in a short script:
# cat /root/bin/mailqstats.sh
#!/bin/bash
mailq | tail -n 1 | awk '{if (NF > 4) {print $5} else {print 0}}'
At this point I guess I could use ssh to access the box and gather this information, but while that might work with one or two servers, can you imagine trying to do that with a hundred? A thousand? The OpenNMS server would have to fork/exec each one, and the performance would be horrible.
Here comes Net-SNMP to the rescue.
Net-SNMP has a directive called “extend”. All I have to do is add the line
extend mailqstats /root/bin/mailqstats.sh
to /etc/snmp/snmpd.conf and reload snmpd. Now Net-SNMP gives me the ability to query an OID and get the results of running the script:
snmpwalk -v1 -c public mail.example.com .1.3.6.1.4.1.8072.1.3.2
Returns
NET-SNMP-EXTEND-MIB::nsExtendNumEntries.0 = INTEGER: 1
NET-SNMP-EXTEND-MIB::nsExtendCommand."mailqstats" = STRING: /root/bin/mailqstats.sh
NET-SNMP-EXTEND-MIB::nsExtendArgs."mailqstats" = STRING:
NET-SNMP-EXTEND-MIB::nsExtendInput."mailqstats" = STRING:
NET-SNMP-EXTEND-MIB::nsExtendCacheTime."mailqstats" = INTEGER: 5
NET-SNMP-EXTEND-MIB::nsExtendExecType."mailqstats" = INTEGER: exec(1)
NET-SNMP-EXTEND-MIB::nsExtendRunType."mailqstats" = INTEGER: run-on-read(1)
NET-SNMP-EXTEND-MIB::nsExtendStorage."mailqstats" = INTEGER: permanent(4)
NET-SNMP-EXTEND-MIB::nsExtendStatus."mailqstats" = INTEGER: active(1)
NET-SNMP-EXTEND-MIB::nsExtendOutput1Line."mailqstats" = STRING: 6
NET-SNMP-EXTEND-MIB::nsExtendOutputFull."mailqstats" = STRING: 6
NET-SNMP-EXTEND-MIB::nsExtendOutNumLines."mailqstats" = INTEGER: 1
NET-SNMP-EXTEND-MIB::nsExtendResult."mailqstats" = INTEGER: 0
NET-SNMP-EXTEND-MIB::nsExtendOutLine."mailqstats".1 = STRING: 6
This tells me a number of things. First, I can have a number of scripts in the extend table. The nsExtendNumEntries value tells me that there is only one on this server.
The next entries are indexed by the name that I used in the extend configuration, in this case “mailqstats”. This will actually be represented by the ASCII equivalent, i.e. for “mailqstats” you get “109.97.105.108.113.115.116.97.116.115” where 109=m, 97=a, 105=i, etc. (this can be converted using Javascript as well).
There are additional configuration options concerning how long the output of the script will be cached, etc.. By default it is 5 seconds, but you can easily extend it. This is useful if the script you are running is expensive in terms of resources.
To get my value, in this case “6”, I can do a number of things. Net-SNMP has an OID for the first line, the full output, and then a table with each line as a separate OID. I tend to use the nsExtendOutLine value, but it is just a personal choice.
Now that I can get the value of the mailqstats.sh script via SNMP, setting up OpenNMS is simple.
First, I have to discover the service. This is done in capsd-configuration.xml:
<protocol-plugin
   protocol="Mailq"
   class-name="org.opennms.netmgt.capsd.plugins.SnmpPlugin" scan="on">
   <property
      key="vbname"
      value=".1.3.6.1.4.1.8072.1.3.2.4.1.2.10.109.97.105.108.113.115.116.97.116.115.1" />
   <property key="timeout" value="2000" />
   <property key="retry" value="1" />
</protocol-plugin>
The SnmpPlugin will check for the existence of the OID, and if it exists the “Mailq” service will be added to the interface. It is also possible to use the SnmpPlugin to check the returned value before adding the service (see the “Router” protocol configuration).
Once I have it discovered, I have a couple of choices for monitoring that value.
I could just monitor it like a service. Let’s say I want to know when the mail queue has 300 or more messages in it. I could configure the monitor to check the value every five minutes and mark the service as down if it was greater than 300. I would do this in the poller-configuration.xml file:
<service name="Mailq" interval="300000" user-defined="false" status="on">
<parameter key="retry" value="1"/>
<parameter key="timeout" value="3000"/>
<parameter key="port" value="161"/>
<parameter key="oid"
value=".1.3.6.1.4.1.8072.1.3.2.4.1.2.10.109.97.105.108.113.115.116.97.116.115.1"/>
<parameter key="operator" value="<"/>
<parameter key="operand" value="300"/>
</service>
This will get the OID every five minutes (300000ms) and test to make sure it is less than 300. If so, the service is “up”. Note that I had to use an HTML entity, <, to represent the “less than” sign.
If you use this method, remember to add the monitor line to the bottom of that file:
<monitor service="Mailq"
         class-name="org.opennms.netmgt.poller.monitors.SnmpMonitor"/>
I use this method for monitoring the status of my RAID controllers, since the values I collect there are always the same (assuming the RAID controller has no errors) and it wouldn’t make sense to graph, say, a bunch of values that are all “3”.
But with the mail queue statistics I wanted a graph, so the next step was to add it to datacollection-config.xml and collect it.
<group name="mailq-stats" ifType="ignore">
   <mibObj
      oid=".1.3.6.1.4.1.8072.1.3.2.4.1.2.10.109.97.105.108.113.115.116.97.116.115"
      instance="1"
      alias="mailqsize"
      type="octetstring" />
</group>
This will attempt to collect on the OID, and if successful, store it in a file called mailqsize.jrb.
Note the type of “octetstring”. If you look at the type of this OID from the walk above, you’ll see it is “string”. RRDtool and JRobin can’t store string data, thus it needs to be converted to a number. Setting the type to “octetstring” causes this to happen (it is converted to a gauge). If it was left as a string, OpenNMS would collect it but store it only once in the strings.properties file for the node. It would not be able to graph it.
The next step in the datacollection-config.xml file is to associate this group with the Net-SNMP system definition:
<systemDef name="Net-SNMP (UCD)">
  <sysoidMask>.1.3.6.1.4.1.2021.250.</sysoidMask>
  <collect>
     <includeGroup>mib2-host-resources-system</includeGroup>
     <includeGroup>mib2-host-resources-memory</includeGroup>
     <includeGroup>mib2-host-resources-storage</includeGroup>
     <includeGroup>net-snmp-disk</includeGroup>
     <includeGroup>ucd-loadavg</includeGroup>
     <includeGroup>ucd-memory</includeGroup>
     <includeGroup>ucd-sysstat</includeGroup>
     <includeGroup>ucd-sysstat-raw</includeGroup>
     <includeGroup>ucd-sysstat-raw-more</includeGroup>
     <includeGroup>mailq-stats</includeGroup>
   </collect>
</systemDef>
The last step is to actually create the graph. Edit snmp-graph.properties:
report.netsnmp.mailq.name=Current Mail Queue Size
report.netsnmp.mailq.columns=mailqsize
report.netsnmp.mailq.type=nodeSnmp
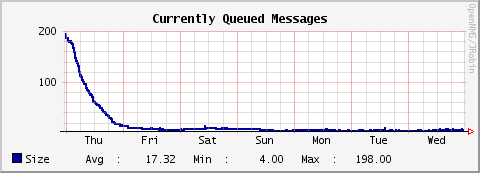
report.netsnmp.mailq.command=--title="Currently Queued Messages"
DEF:queue={rrd1}:mailqsize:AVERAGE
LINE2:queue#0000A0:"Size "
GPRINT:queue:AVERAGE:"Avg \: %8.2lf "
GPRINT:queue:MIN:"Min \: %8.2lf "
GPRINT:queue:MAX:"Max \: %8.2lf \n"
and add the “netsnmp.mailq” report to the “reports=” line at the top of the file.
Restart OpenNMS and now I should be able to see the size of my mail queue.
I can also set up a threshold event which can trigger a notice that will let me know the queue is high.
The extend feature of Net-SNMP is pure awesomeness, and there are a huge number of uses for it. I hope this example will prove useful. If you are using this with OpenNMS, add a comment to this post and tell me how you use it.
Tarus-
This would be a nice doc to wiki-ize. I need to setup something similar for iostat and ldap requests.
Sorry I missed you in PDX!
Ken
+1 for wider distribution, but, for the uninitiated, it would be great to have a primer on where you got the OIDs.
I mean, okay, mailstats=109.97.105.108.113.115.116.97.116.115, cool, got it.
And you pulled out .1.3.6.1.4.1.8072.1.3.2, which I can google and figure out in reverse-engineer mode, but, (1) it’s harder to figure out in forward-engineer mode, and (2) there’s no explaination for the glue of 4.1.2.10 between base oid and mailstats.
Part of why I loathe SNMP is that, for as prevalent, as old as it is, nobody’s made MIBs trivially accessible. It’s like trying to diagnose a server with cat and /proc: it’s majorly efficient and you can do it, but, it takes a lot of upfront knowledge.